📅 Last updated: 8 May 2026
· 🏷 Topic: Volatility, standard deviation, risk
· 🇧🇪 For: Belgian investors
Volatility is how strongly the price of an investment moves around its average. High volatility = large ups and downs. Low volatility = more stable.
The maths
Standard deviation of return = how much the annual return deviates on average from the long-term average.
| Asset class | Volatility (annual) |
|---|---|
| Savings account | <1% |
| Belgian government bonds (short) | 2-5% |
| World index ETF (equities) | 15-20% |
| Small-cap ETF | 25-30% |
| Bitcoin | 70-80% |
| Memecoins | 100%+ |
What this means in practice
With an average annual return of 7% and volatility of 17%:
- 68% of years: return between -10% and +24% (one standard deviation).
- 95% of years: return between -27% and +41% (two standard deviations).
- Outside this range: exceptional years (2008, 2020).
So: a world index ETF can easily deviate 10-20% from the “expected” 7% in an average year.
Volatility ≠ return
Important distinction:
- Volatility = size of swings.
- Drawdown = actual loss from peak to trough.
- Return = what you actually pocket over a period.
High volatility can be good (strong rises, with some drops) or bad (everything negative).
How to use volatility in decision-making
For risk tolerance:
– Anyone who cannot emotionally bear a 30% drawdown should not be 100% in a product with 17% volatility.
– 60/40 (equities/bonds) typically has volatility of 9-12% — less painful in bad years.
For portfolio construction:
– Mixing a 15% volatile world index ETF + 5% volatile bond ETF gives ~10% portfolio volatility (thanks to decorrelation).
For horizon:
– At a 1-year horizon: volatility assesses risk of loss.
– At a 30-year horizon: volatility over a single year matters less — the compounding effect drowns out the swings.
Maximum drawdown — a more practical measure
For many people, maximum drawdown (largest peak-to-trough loss in a period) is more intuitive than standard deviation:
| Asset | Historical max drawdown |
|---|---|
| MSCI World | ~-55% (2008-2009) |
| S&P 500 | ~-49% (2007-2009) |
| BEL 20 | ~-65% (2007-2009) |
| Bitcoin | ~-85% (multiple times) |
| Gold | ~-45% (1980-1982) |
| 60/40 portfolio | ~-30% |
Question: can you emotionally bear a 50% drawdown for 12-24 months without panic-selling?
The “sleep” test
A good rule of thumb: choose an allocation where you still sleep well in a 30% drawdown. If you then think “I have to get out”, the allocation is too aggressive for you.
💡 Real risk tolerance only becomes apparent during an actual crash. Until then, every estimate is hypothetical. Therefore, start more conservatively than you estimate you can handle.
🔗 See Determining your risk profile(NL) for the broader risk assessment.
What volatility means in practice
A standard deviation says little until you convert it into euros. On a €50,000 global equity portfolio, a 20% fall — historically not an exceptional event — is a €10,000 paper loss. The question is not whether that happens, but whether you stay invested when it does.
That is why the useful measure is not volatility but drawdown: how deep it went, and how long recovery took. Volatility measures movement in both directions; drawdown measures the only thing that actually makes investors sell.
Why panic-selling costs more in Belgium
Selling into a fall does more than lock in the loss. Since 1 January 2026 two further effects apply:
- The sale is a taxable event. Stock-exchange tax is due on sale regardless of profit or loss — 0.12% to 1.32% depending on the fund. You pay to get out.
- Loss offset is limited. Realised losses offset realised gains only within the same calendar year. Sell at a loss in December and recover in March, and the loss falls in a different year from the later gain.
Buying back later incurs stock-exchange tax again. The round trip out and back therefore costs transaction tax twice, plus the risk of missing the recovery.
Making volatility manageable
- Match the horizon to the portfolio, not the other way round. Money needed within three years does not belong in equities.
- Keep an emergency fund outside the market, so a fall never coincides with a forced sale.
- Decide in advance what you do at −30%. A rule written down in calm conditions survives better than a judgement made in panic.
- Rebalance with new contributions rather than sales — avoiding both the stock-exchange tax and a taxable gain.
Sources
- Wikifin — Volatility and risk
- MSCI / FTSE — Index volatility data
- SPIVA Europe — Long-term performance metrics
Pension Planning for Expats in Belgium
Pension planning for expats in Belgium: 1st/2nd/3rd pillar eligibility, transferring foreign pensions, and the 35% expat tax regime.
Non-Resident Tax Treatment in Belgium
How non-residents are taxed on Belgian-source income: rental property, dividends, pensions and capital gains. 2026 rates and treaty exemptions explained.

ETF Investing in Belgium (Complete Guide)
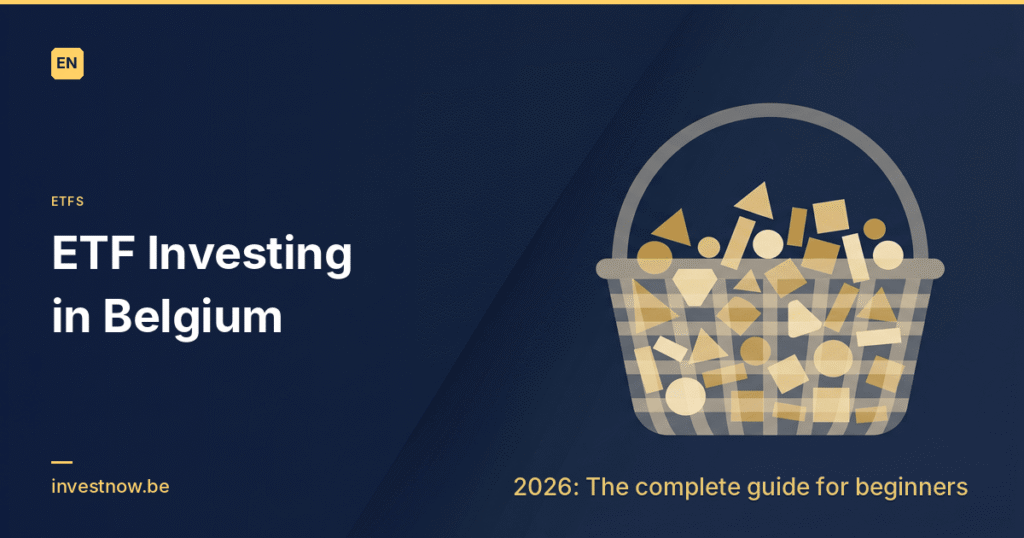
ETF investing in Belgium: UCITS vs US ETFs, TOB tiers, accumulating vs distributing, IWDA, VWCE and tax treatment. Complete 2026 beginner guide.